Graphing – web component
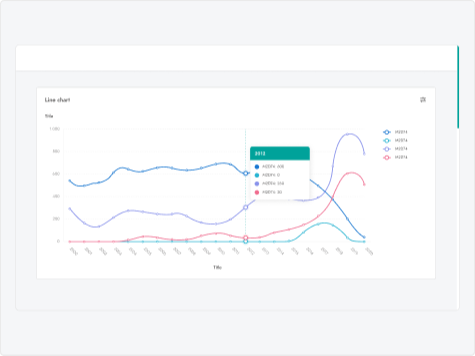
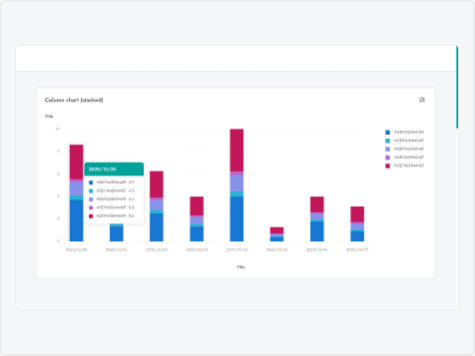
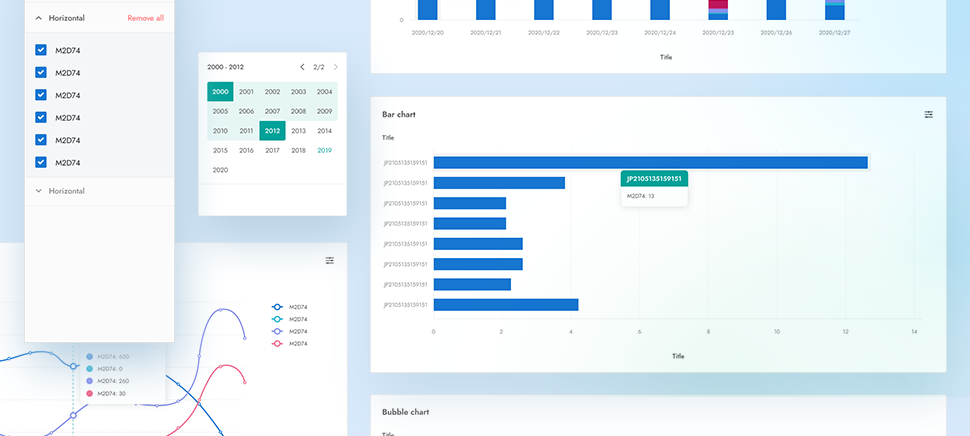
Convert input data into visual graph: line charts, bar charts, bubble charts,… then export to Word, PDF or PowerPoint files.
Development time:2 months
Team:1 member
Technologies:Figma
This is a component of an AI Samurai system ordered by a Japanese customer.
The requirement was to visualize information and data, then allow users to export to document formats such as Word, PDF and PowerPoint.
The requirement was to visualize information and data, then allow users to export to document formats such as Word, PDF and PowerPoint. However, the existing system had no design standards for colors, fonts, spacing and related components, making it difficult to unify the design at the very beginning of the project.
Our team had been thoroughly discussing with the customer to deepen mutual understanding, then in short two months, we were able to fully grasp their intention and complete the design document.
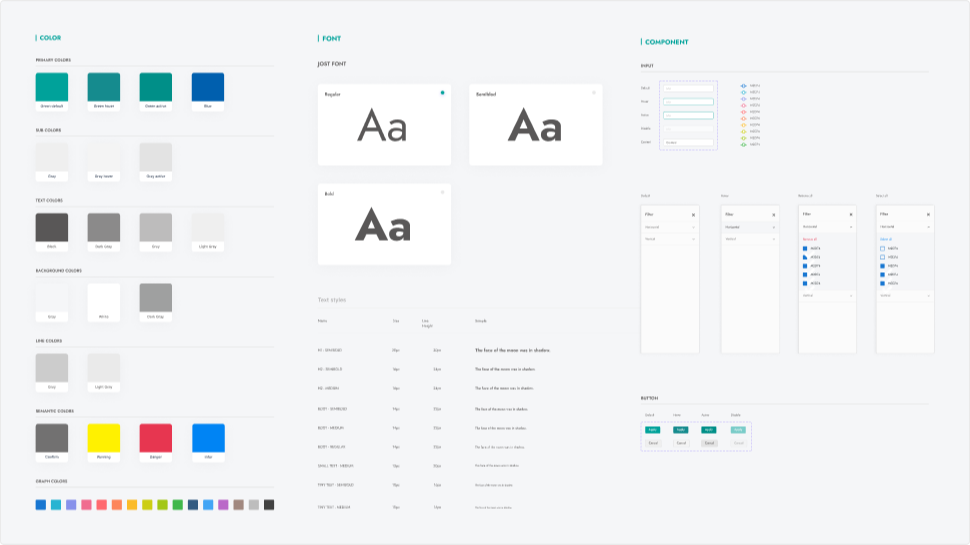
The final design was a perfect match of style, color as well as interactive ability, bringing significant improvement in user experience.